Resource
| Id | DNase-seq/ENCSR000ELA |
|---|---|
| Type | position_score |
| Version | 0 |
| Summary | DNase-seq ENCSR000ELA [biosample_summary="Homo sapiens D721Med"] |
| Description |
status: released biological_replicates: Rep 1 summary: output_type: peaks audit_internal_action: Released analysis {ENCAN817ULI|/analyses/ENCAN817ULI/} has in progress subobject document {93a73da9-32e2-4aea-9001-d3fc6a964b2e|/documents/93a73da9-32e2-4aea-9001-d3fc6a964b2e/} audit_warning: Signal Portion of Tags (SPOT) is a measure of enrichment, analogous to the commonly used fraction of reads in peaks metric. ENCODE processed alignment files {ENCFF855PPS|/files/ENCFF855PPS/} processed by DNase-seq ENCODE4 v3.0.0 GRCh38 pipeline ({ENCPL848KLD|/pipelines/ENCPL848KLD/}) for GRCh38 assembly have a SPOT1 score of 0.35. According to ENCODE standards, SPOT1 score of 0.4 or higher is considered a product of high quality data. Any sample with a SPOT1 score <0.3 should be targeted for replacement with a higher quality sample, and a SPOT1 score of 0.25 is considered minimally acceptable SPOT1 score of 0.25 is considered minimally acceptable for rare and hard to find primary tissues. (See {ENCODE DNase-seq data standards|/data-standards/dnase-seq-encode4/}) |
| Labels |
|
Scores (1)
| ID | Type | Default annotation | Description | Histogram | Range | Summary |
|---|---|---|---|---|---|---|
| DNase-seq_ENCSR000ELA | float |
DNase-seq_ENCSR000ELA |
DNase-seq ENCSR000ELA [biosample_summary="Homo sapiens D721Med"]
|
 |
[0.126, 20.6] |
|
n counts base pairs; sd is the population standard deviation.
Coverage
| Chromosome | Covered positions | Covered % | Segments |
|---|---|---|---|
| all chromosomes | 7280569 | 0.23% | 42893 |
| chr1 | 764084 | 0.31% | 4473 |
| chr2 | 497108 | 0.21% | 2989 |
| chr3 | 391224 | 0.20% | 2333 |
| chr4 | 241621 | 0.13% | 1486 |
| chr5 | 336184 | 0.19% | 2012 |
| chr6 | 314226 | 0.18% | 1889 |
| chr7 | 380775 | 0.24% | 2217 |
| chr8 | 336119 | 0.23% | 1982 |
| chr9 | 347946 | 0.25% | 1996 |
| chr10 | 266611 | 0.20% | 1635 |
| chr11 | 405013 | 0.30% | 2385 |
| chr12 | 338384 | 0.25% | 2005 |
| chr13 | 122914 | 0.11% | 759 |
| chr14 | 240315 | 0.22% | 1413 |
| chr15 | 233678 | 0.23% | 1427 |
| chr16 | 265025 | 0.29% | 1501 |
| chr17 | 482018 | 0.58% | 2773 |
| chr18 | 204333 | 0.25% | 1239 |
| chr19 | 583264 | 1.00% | 3211 |
| chr20 | 188989 | 0.29% | 1116 |
| chr21 | 76756 | 0.16% | 459 |
| chr22 | 144863 | 0.29% | 859 |
| chrX | 119119 | 0.08% | 734 |
| 3343 contigs with no values (186304500 bp) | 0 | 0.00% | 0 |
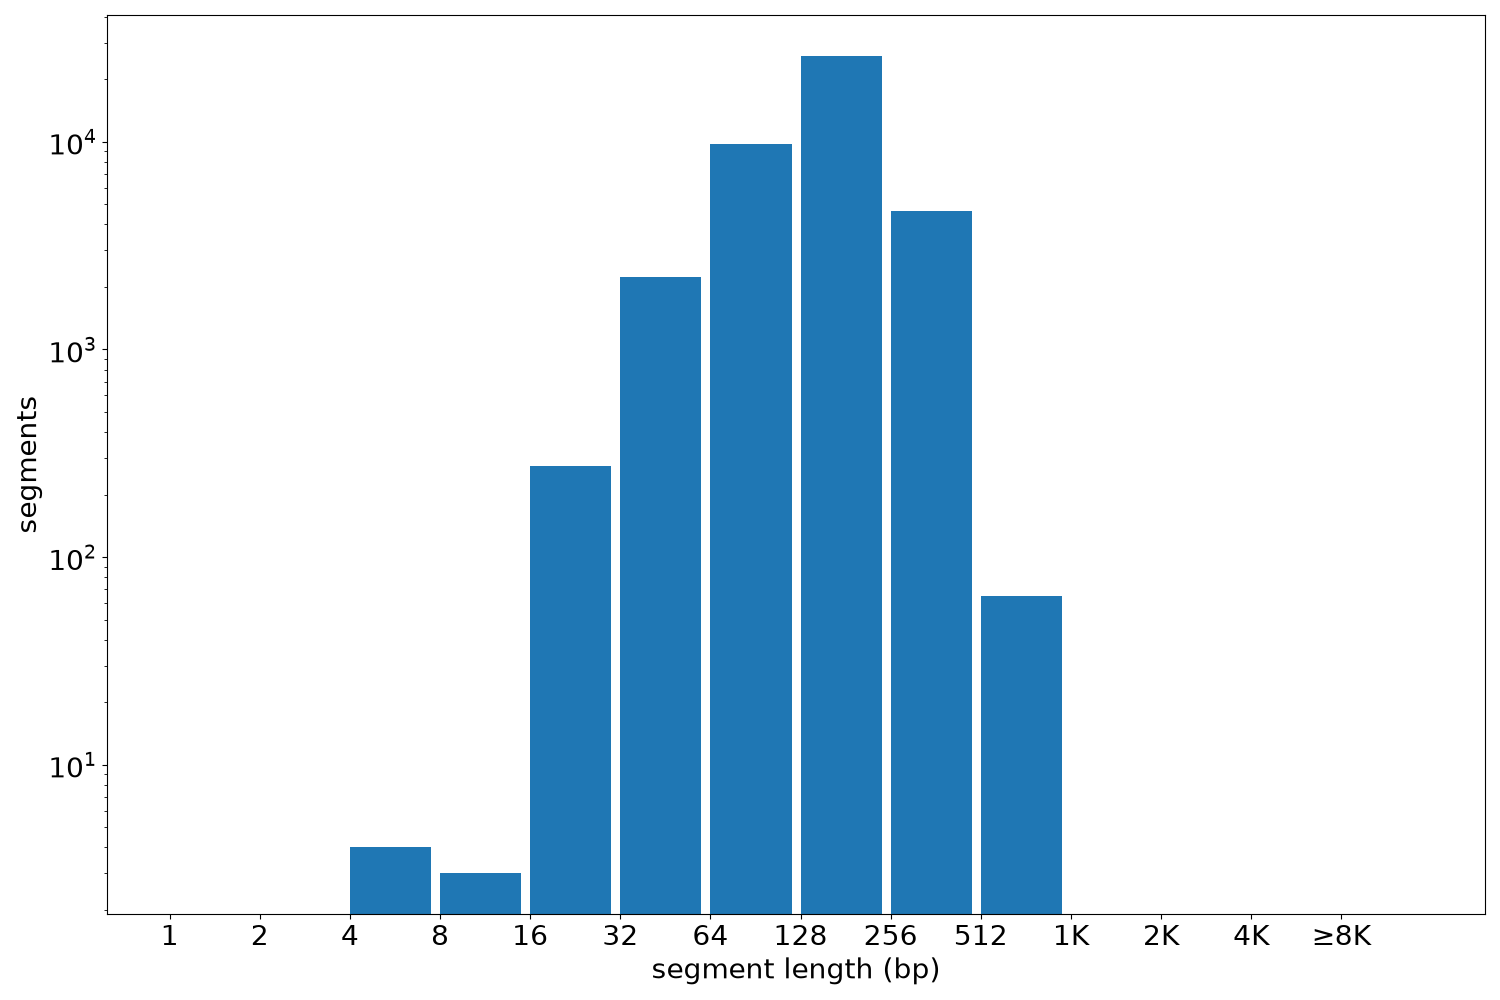
Segment lengths
| segments | min | max | mean | median | |
|---|---|---|---|---|---|
| segments | 42893 | 5 | 805 | 169.74 | 162 |
Files
| Filename | Size | md5 |
|---|---|---|
| ENCFF722JSP.bed.gz | 466.42 KB | 9c33b5dba02e27da6f06f09470d67f1f |
| ENCFF722JSP.tabix.bed.gz | 419.69 KB | 6fdaed59e5d05bdea787b7125f47f41d |
| ENCFF722JSP.tabix.bed.gz.tbi | 221.74 KB | 2235223ff9fc9fcf27fd7f119cd05540 |
| genomic_resource.yaml | 2.13 KB | 1a127f677a64ef3164c3c277539184e5 |
| statistics/ |