Resource
| Id | DNase-seq/ENCSR000EKI |
|---|---|
| Type | position_score |
| Version | 0 |
| Summary | DNase-seq ENCSR000EKI [biosample_summary="Homo sapiens CWRU1"] |
| Description |
status: released biological_replicates: Rep 1 summary: output_type: peaks audit_internal_action: Released analysis {ENCAN095PWN|/analyses/ENCAN095PWN/} has in progress subobject document {96da45e9-8cb8-4f47-a764-c1ff1357f0e8|/documents/96da45e9-8cb8-4f47-a764-c1ff1357f0e8/} audit_warning: Signal Portion of Tags (SPOT) is a measure of enrichment, analogous to the commonly used fraction of reads in peaks metric. ENCODE processed alignment files {ENCFF478MBJ|/files/ENCFF478MBJ/} processed by DNase-seq ENCODE4 v3.0.0 GRCh38 pipeline ({ENCPL848KLD|/pipelines/ENCPL848KLD/}) for GRCh38 assembly have a SPOT1 score of 0.32. According to ENCODE standards, SPOT1 score of 0.4 or higher is considered a product of high quality data. Any sample with a SPOT1 score <0.3 should be targeted for replacement with a higher quality sample, and a SPOT1 score of 0.25 is considered minimally acceptable SPOT1 score of 0.25 is considered minimally acceptable for rare and hard to find primary tissues. (See {ENCODE DNase-seq data standards|/data-standards/dnase-seq-encode4/}) |
| Labels |
|
Scores (1)
| ID | Type | Default annotation | Description | Histogram | Range | Summary |
|---|---|---|---|---|---|---|
| DNase-seq_ENCSR000EKI | float |
DNase-seq_ENCSR000EKI |
DNase-seq ENCSR000EKI [biosample_summary="Homo sapiens CWRU1"]
|
 |
[0.0517, 11.2] |
|
n counts base pairs; sd is the population standard deviation.
Coverage
| Chromosome | Covered positions | Covered % | Segments |
|---|---|---|---|
| all chromosomes | 21350056 | 0.66% | 116682 |
| chr1 | 2037404 | 0.82% | 10913 |
| chr2 | 1552470 | 0.64% | 8657 |
| chr3 | 1253433 | 0.63% | 6911 |
| chr4 | 971959 | 0.51% | 5433 |
| chr5 | 1102836 | 0.61% | 6100 |
| chr6 | 1166366 | 0.68% | 6440 |
| chr7 | 1100098 | 0.69% | 6009 |
| chr8 | 919447 | 0.63% | 5105 |
| chr9 | 928518 | 0.67% | 5100 |
| chr10 | 963819 | 0.72% | 5340 |
| chr11 | 1183383 | 0.88% | 6383 |
| chr12 | 1047175 | 0.79% | 5640 |
| chr13 | 504865 | 0.44% | 2867 |
| chr14 | 686040 | 0.64% | 3709 |
| chr15 | 665410 | 0.65% | 3593 |
| chr16 | 753716 | 0.83% | 4105 |
| chr17 | 1009370 | 1.21% | 5396 |
| chr18 | 454885 | 0.57% | 2554 |
| chr19 | 1141779 | 1.95% | 5859 |
| chr20 | 595285 | 0.92% | 3227 |
| chr21 | 212892 | 0.46% | 1187 |
| chr22 | 444673 | 0.88% | 2417 |
| chrX | 628309 | 0.40% | 3588 |
| chrY | 25924 | 0.05% | 149 |
| 3342 contigs with no values (129077085 bp) | 0 | 0.00% | 0 |
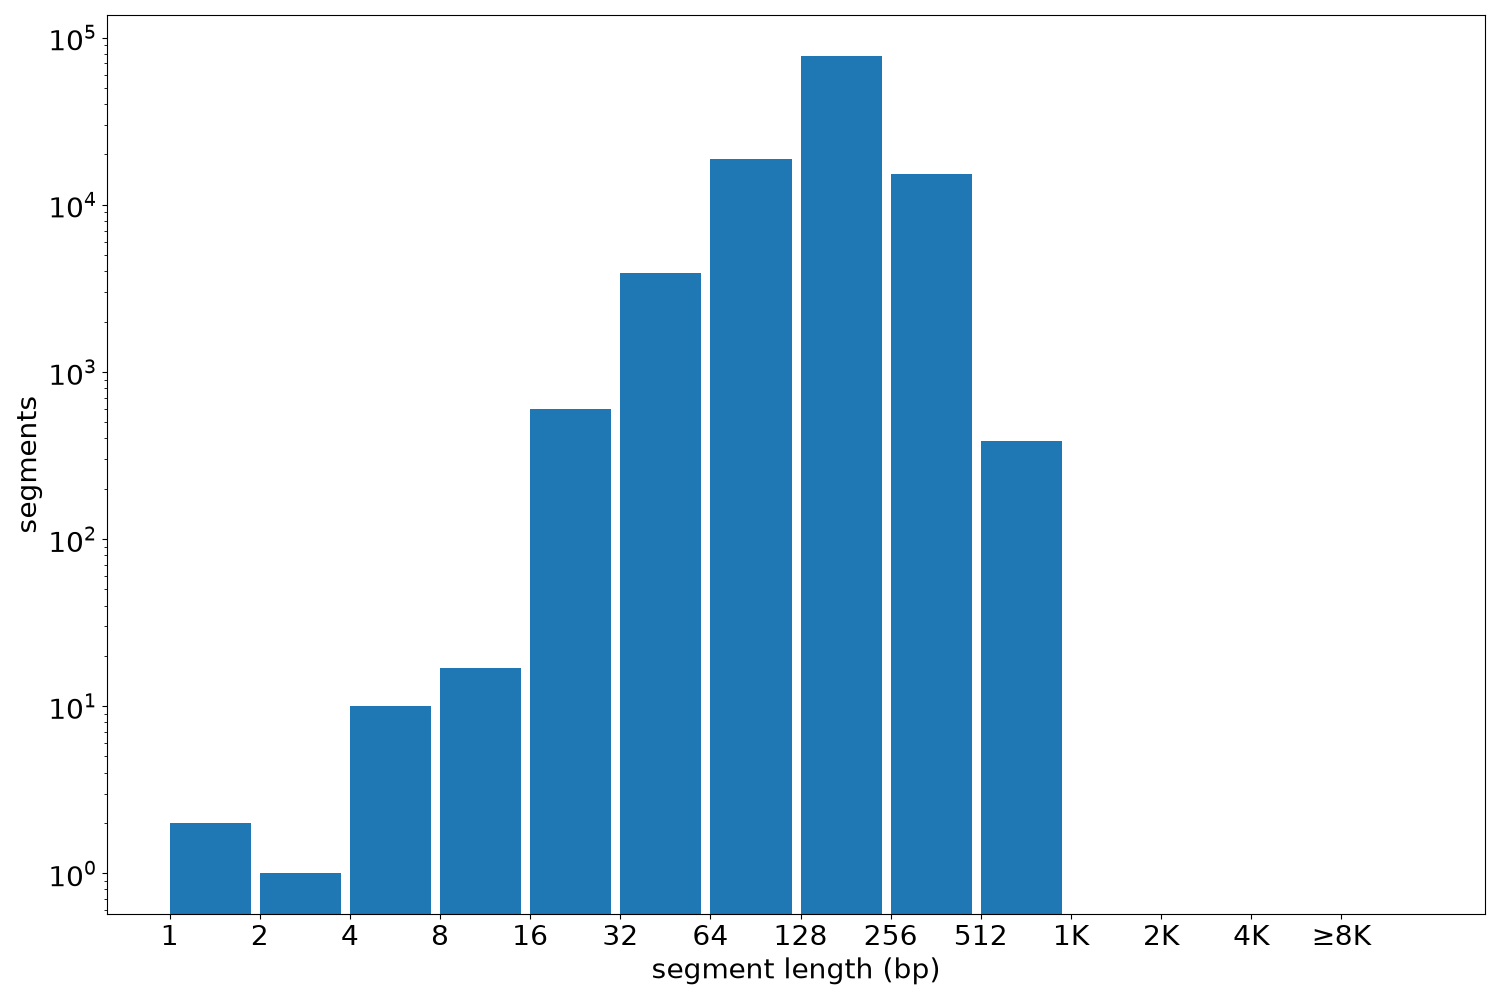
Segment lengths
| segments | min | max | mean | median | |
|---|---|---|---|---|---|
| segments | 116682 | 1 | 860 | 182.98 | 180 |
Files
| Filename | Size | md5 |
|---|---|---|
| ENCFF540VPT.bed.gz | 1.23 MB | 2a07bb22de9334fdeb742aae9baa1866 |
| ENCFF540VPT.tabix.bed.gz | 1.13 MB | fb8308b4a519111867d434f1bee17b85 |
| ENCFF540VPT.tabix.bed.gz.tbi | 475.95 KB | eef8f41b2f96262655b8adb641cd64b0 |
| genomic_resource.yaml | 2.12 KB | 7d69023d6a1bff68f10ef71f95855510 |
| statistics/ |