Resource
| Id | DNase-seq/ENCSR000EKD |
|---|---|
| Type | position_score |
| Version | 0 |
| Summary | DNase-seq ENCSR000EKD [biosample_summary="Homo sapiens HuH-7"] |
| Description |
status: released biological_replicates: Rep 1 summary: output_type: peaks audit_error: Alignment file {ENCFF172VLC|/files/ENCFF172VLC/} processed by DNase-seq ENCODE3 GRCh38 pipeline ( {ENCPL001DNS|/pipelines/ENCPL001DNS/} ) for GRCh38 assembly has 249407 mapped reads. According to ENCODE standards, conventional DNase-seq profile requires a minimum of 20 million uniquely mapped reads to generate a reliable SPOT (Signal Portion of Tags) score. The recommended value is > 50 million. For deep, foot-printing depth DNase-seq 150-200 million uniquely mapped reads are recommended. (See {ENCODE DNase-seq data standards|/data-standards/dnase-seq/}) audit_error: Signal Portion of Tags (SPOT) is a measure of enrichment, analogous to the commonly used fraction of reads in peaks metric. ENCODE processed alignment files {ENCFF172VLC|/files/ENCFF172VLC/} processed by DNase-seq ENCODE3 GRCh38 pipeline ({ENCPL001DNS|/pipelines/ENCPL001DNS/}) for GRCh38 assembly have a SPOT1 score of 0.22. According to ENCODE standards, SPOT1 score of 0.4 or higher is considered a product of high quality data. Any sample with a SPOT1 score <0.3 should be targeted for replacement with a higher quality sample, and a SPOT1 score of 0.25 is considered minimally acceptable SPOT1 score of 0.25 is considered minimally acceptable for rare and hard to find primary tissues. (See {ENCODE DNase-seq data standards|/data-standards/dnase-seq/}) audit_internal_action: Archived analysis {ENCAN803FVU|/analyses/ENCAN803FVU/} has in progress subobject quality standard {encode3-dnase|/quality-standards/encode3-dnase/} |
| Labels |
|
Scores (1)
| ID | Type | Default annotation | Description | Histogram | Range | Summary |
|---|---|---|---|---|---|---|
| DNase-seq_ENCSR000EKD | float |
DNase-seq_ENCSR000EKD |
DNase-seq ENCSR000EKD [biosample_summary="Homo sapiens HuH-7"]
|
 |
[7, 52] |
|
n counts base pairs; sd is the population standard deviation.
Coverage
| Chromosome | Covered positions | Covered % | Segments |
|---|---|---|---|
| all chromosomes | 13650 | <0.01% | 91 |
| chr1 | 900 | <0.01% | 6 |
| chr2 | 300 | <0.01% | 2 |
| chr3 | 750 | <0.01% | 5 |
| chr4 | 300 | <0.01% | 2 |
| chr5 | 450 | <0.01% | 3 |
| chr6 | 150 | <0.01% | 1 |
| chr7 | 450 | <0.01% | 3 |
| chr8 | 150 | <0.01% | 1 |
| chr9 | 900 | <0.01% | 6 |
| chr10 | 150 | <0.01% | 1 |
| chr11 | 750 | <0.01% | 5 |
| chr12 | 750 | <0.01% | 5 |
| chr13 | 150 | <0.01% | 1 |
| chr14 | 150 | <0.01% | 1 |
| chr15 | 450 | <0.01% | 3 |
| chr16 | 1500 | <0.01% | 10 |
| chr17 | 1350 | <0.01% | 9 |
| chr19 | 2400 | <0.01% | 16 |
| chr20 | 1350 | <0.01% | 9 |
| chr22 | 300 | <0.01% | 2 |
| 3346 contigs with no values (469428663 bp) | 0 | 0.00% | 0 |
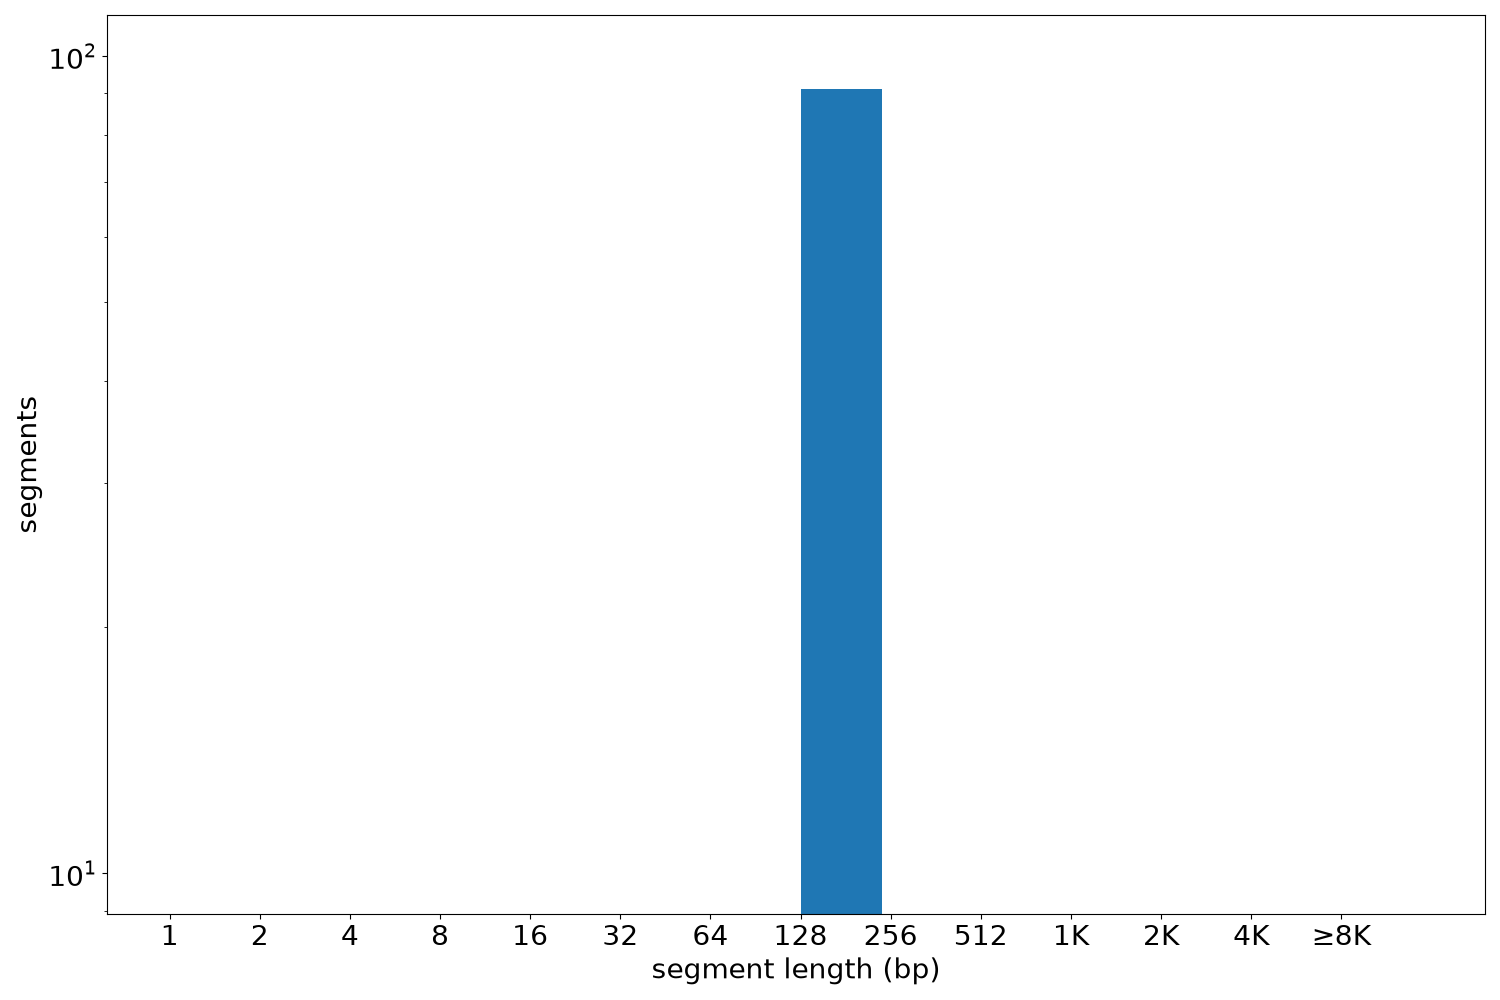
Segment lengths
| segments | min | max | mean | median | |
|---|---|---|---|---|---|
| segments | 91 | 150 | 150 | 150 | 150 |
Files
| Filename | Size | md5 |
|---|---|---|
| ENCFF220TWO.bed.gz | 1.08 KB | 57e4b8833477128a2b6f270b07c6ac66 |
| ENCFF220TWO.tabix.bed.gz | 917.0 B | e43df58f3b68463c5679847c686e1f35 |
| ENCFF220TWO.tabix.bed.gz.tbi | 3.96 KB | 9362b6d804f3fcfe10f394f5243da5a9 |
| genomic_resource.yaml | 2.7 KB | c370c806af078c1e0fb083673c5be80f |
| statistics/ |