Resource
| Id | DNase-seq/ENCSR000EKC |
|---|---|
| Type | position_score |
| Version | 0 |
| Summary | DNase-seq ENCSR000EKC [biosample_summary="Homo sapiens HTR-8/SVneo"] |
| Description |
status: released biological_replicates: Rep 1 summary: output_type: peaks audit_internal_action: Released analysis {ENCAN833TFC|/analyses/ENCAN833TFC/} has in progress subobject document {5e8e80bb-a078-4eb4-9707-36659d5037e9|/documents/5e8e80bb-a078-4eb4-9707-36659d5037e9/} audit_warning: Signal Portion of Tags (SPOT) is a measure of enrichment, analogous to the commonly used fraction of reads in peaks metric. ENCODE processed alignment files {ENCFF656TNN|/files/ENCFF656TNN/} processed by DNase-seq ENCODE4 v3.0.0 GRCh38 pipeline ({ENCPL848KLD|/pipelines/ENCPL848KLD/}) for GRCh38 assembly have a SPOT1 score of 0.26. According to ENCODE standards, SPOT1 score of 0.4 or higher is considered a product of high quality data. Any sample with a SPOT1 score <0.3 should be targeted for replacement with a higher quality sample, and a SPOT1 score of 0.25 is considered minimally acceptable SPOT1 score of 0.25 is considered minimally acceptable for rare and hard to find primary tissues. (See {ENCODE DNase-seq data standards|/data-standards/dnase-seq-encode4/}) |
| Labels |
|
Scores (1)
| ID | Type | Default annotation | Description | Histogram | Range | Summary |
|---|---|---|---|---|---|---|
| DNase-seq_ENCSR000EKC | float |
DNase-seq_ENCSR000EKC |
DNase-seq ENCSR000EKC [biosample_summary="Homo sapiens HTR-8/SVneo"]
|
 |
[0.0988, 16.6] |
|
n counts base pairs; sd is the population standard deviation.
Coverage
| Chromosome | Covered positions | Covered % | Segments |
|---|---|---|---|
| all chromosomes | 17222809 | 0.54% | 92208 |
| chr1 | 1590077 | 0.64% | 8486 |
| chr2 | 1434687 | 0.59% | 7745 |
| chr3 | 1117362 | 0.56% | 6034 |
| chr4 | 856837 | 0.45% | 4766 |
| chr5 | 1042208 | 0.57% | 5540 |
| chr6 | 1037806 | 0.61% | 5706 |
| chr7 | 767412 | 0.48% | 4171 |
| chr8 | 768585 | 0.53% | 4068 |
| chr9 | 653990 | 0.47% | 3527 |
| chr10 | 790056 | 0.59% | 4272 |
| chr11 | 895227 | 0.66% | 4759 |
| chr12 | 868730 | 0.65% | 4602 |
| chr13 | 366222 | 0.32% | 2045 |
| chr14 | 625069 | 0.58% | 3291 |
| chr15 | 572400 | 0.56% | 3074 |
| chr16 | 560020 | 0.62% | 2929 |
| chr17 | 878238 | 1.05% | 4543 |
| chr18 | 298893 | 0.37% | 1644 |
| chr19 | 693329 | 1.18% | 3467 |
| chr20 | 507527 | 0.79% | 2621 |
| chr21 | 206811 | 0.44% | 1126 |
| chr22 | 288327 | 0.57% | 1538 |
| chrX | 402996 | 0.26% | 2254 |
| 3343 contigs with no values (186304500 bp) | 0 | 0.00% | 0 |
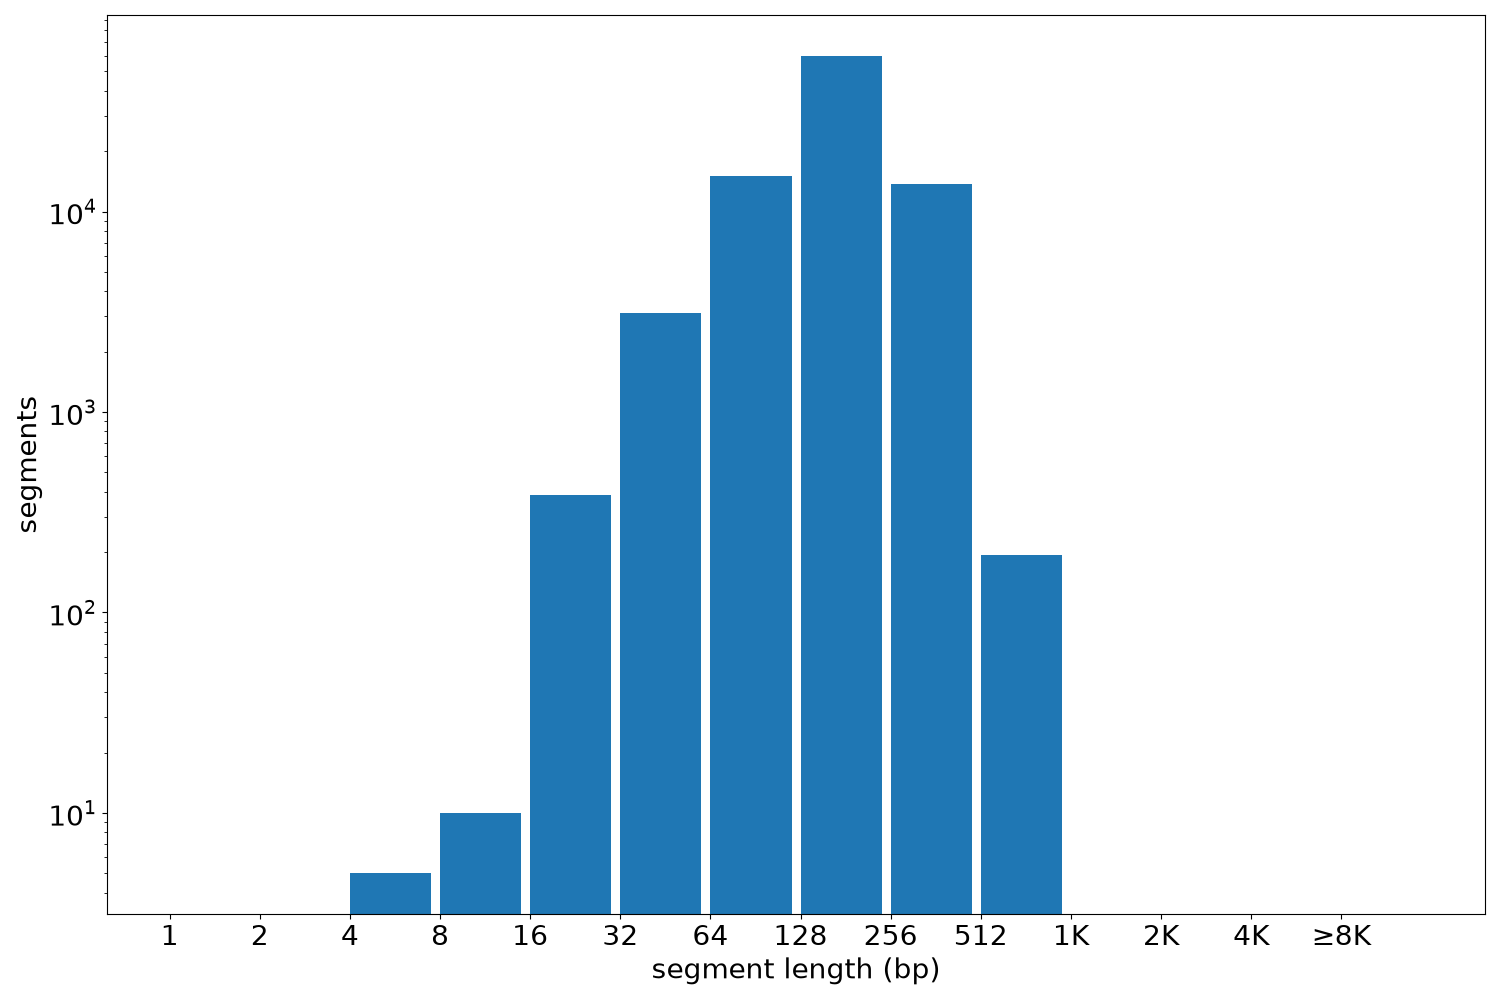
Segment lengths
| segments | min | max | mean | median | |
|---|---|---|---|---|---|
| segments | 92208 | 5 | 840 | 186.78 | 180 |
Files
| Filename | Size | md5 |
|---|---|---|
| ENCFF499NJC.bed.gz | 972.22 KB | 13e77142201d56058c8bc67ca40e4dd4 |
| ENCFF499NJC.tabix.bed.gz | 881.95 KB | 81b81331338200f788ebdc6c43530810 |
| ENCFF499NJC.tabix.bed.gz.tbi | 419.02 KB | a77a74ebcb76ea42dc9a2b5a51f47578 |
| genomic_resource.yaml | 2.14 KB | e0e0823e00a7e22aa00c8dcf819fb825 |
| statistics/ |