Resource
| Id | DNase-seq/ENCSR000EJE |
|---|---|
| Type | position_score |
| Version | 0 |
| Summary | DNase-seq ENCSR000EJE [biosample_summary="Homo sapiens GM12891"] |
| Description |
status: released biological_replicates: Rep 1 summary: output_type: peaks audit_internal_action: Released analysis {ENCAN495IXS|/analyses/ENCAN495IXS/} has in progress subobject document {b4faa0d4-9879-478f-818e-cce138464433|/documents/b4faa0d4-9879-478f-818e-cce138464433/} audit_warning: Signal Portion of Tags (SPOT) is a measure of enrichment, analogous to the commonly used fraction of reads in peaks metric. ENCODE processed alignment files {ENCFF851MCJ|/files/ENCFF851MCJ/} processed by DNase-seq ENCODE4 v3.0.0 GRCh38 pipeline ({ENCPL848KLD|/pipelines/ENCPL848KLD/}) for GRCh38 assembly have a SPOT1 score of 0.36. According to ENCODE standards, SPOT1 score of 0.4 or higher is considered a product of high quality data. Any sample with a SPOT1 score <0.3 should be targeted for replacement with a higher quality sample, and a SPOT1 score of 0.25 is considered minimally acceptable SPOT1 score of 0.25 is considered minimally acceptable for rare and hard to find primary tissues. (See {ENCODE DNase-seq data standards|/data-standards/dnase-seq-encode4/}) |
| Labels |
|
Scores (1)
| ID | Type | Default annotation | Description | Histogram | Range | Summary |
|---|---|---|---|---|---|---|
| DNase-seq_ENCSR000EJE | float |
DNase-seq_ENCSR000EJE |
DNase-seq ENCSR000EJE [biosample_summary="Homo sapiens GM12891"]
|
 |
[0.137, 20.5] |
|
n counts base pairs; sd is the population standard deviation.
Coverage
| Chromosome | Covered positions | Covered % | Segments |
|---|---|---|---|
| all chromosomes | 9496991 | 0.30% | 51787 |
| chr1 | 909403 | 0.37% | 4956 |
| chr2 | 674175 | 0.28% | 3680 |
| chr3 | 540892 | 0.27% | 2957 |
| chr4 | 391920 | 0.21% | 2151 |
| chr5 | 448493 | 0.25% | 2469 |
| chr6 | 494866 | 0.29% | 2722 |
| chr7 | 450985 | 0.28% | 2461 |
| chr8 | 394565 | 0.27% | 2190 |
| chr9 | 407038 | 0.29% | 2263 |
| chr10 | 425978 | 0.32% | 2348 |
| chr11 | 535697 | 0.40% | 2871 |
| chr12 | 467527 | 0.35% | 2538 |
| chr13 | 185520 | 0.16% | 1037 |
| chr14 | 328613 | 0.31% | 1781 |
| chr15 | 308082 | 0.30% | 1694 |
| chr16 | 392189 | 0.43% | 2094 |
| chr17 | 544079 | 0.65% | 2957 |
| chr18 | 180538 | 0.22% | 984 |
| chr19 | 575559 | 0.98% | 2978 |
| chr20 | 275623 | 0.43% | 1546 |
| chr21 | 106835 | 0.23% | 576 |
| chr22 | 253613 | 0.50% | 1371 |
| chrX | 199667 | 0.13% | 1134 |
| chrY | 5134 | 0.01% | 29 |
| 3342 contigs with no values (129077085 bp) | 0 | 0.00% | 0 |
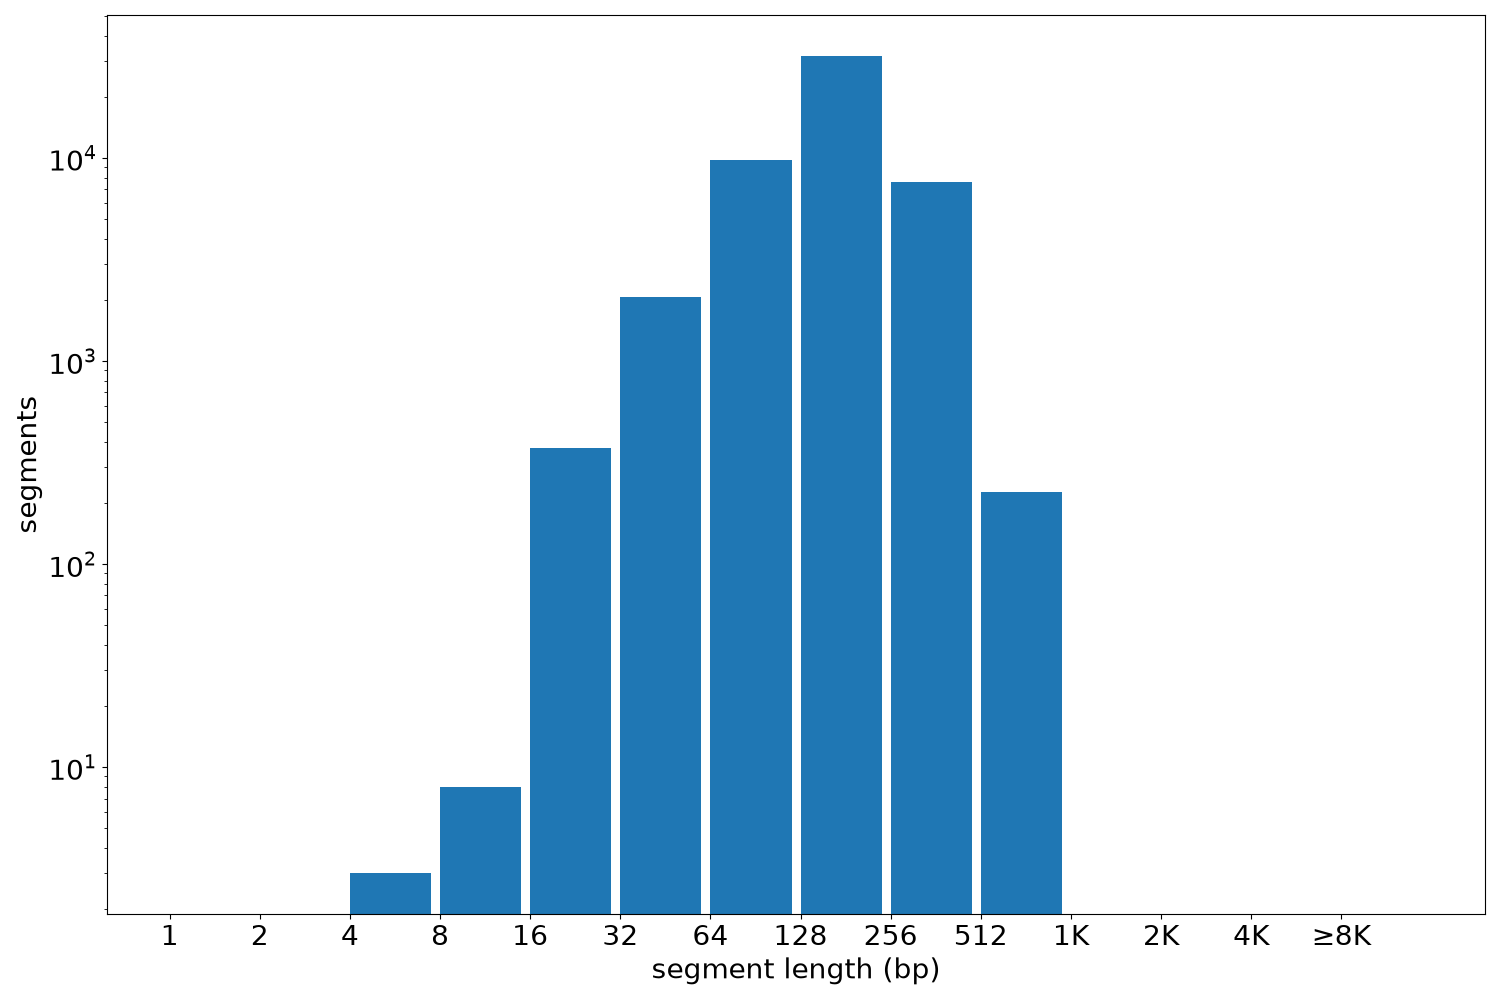
Segment lengths
| segments | min | max | mean | median | |
|---|---|---|---|---|---|
| segments | 51787 | 4 | 880 | 183.39 | 180 |
Files
| Filename | Size | md5 |
|---|---|---|
| ENCFF087IIE.bed.gz | 551.86 KB | 1b9f4c76eded2b15f6f7db92bb46be02 |
| ENCFF087IIE.tabix.bed.gz | 501.65 KB | 675917ead88373977b9cfacdb130efd5 |
| ENCFF087IIE.tabix.bed.gz.tbi | 251.53 KB | a77c6d59bbd83ddd9f2c332309b9714e |
| genomic_resource.yaml | 2.13 KB | 9f4c13fe6bb6d4c00c59dc9db7a45e1a |
| statistics/ |