Resource
| Id | DNase-seq/ENCSR000EIR |
|---|---|
| Type | position_score |
| Version | 0 |
| Summary | DNase-seq ENCSR000EIR [biosample_summary="Homo sapiens GM03348 genetically modified (insertion) using transduction targeting H. sapiens MYOD1"] |
| Description |
status: released biological_replicates: Rep 1 summary: genetically modified (insertion) using transduction targeting H. sapiens MYOD1 output_type: peaks audit_internal_action: Released analysis {ENCAN288CIU|/analyses/ENCAN288CIU/} has in progress subobject document {73c35abd-510b-4781-a547-daefb0ea5a40|/documents/73c35abd-510b-4781-a547-daefb0ea5a40/} audit_warning: Signal Portion of Tags (SPOT) is a measure of enrichment, analogous to the commonly used fraction of reads in peaks metric. ENCODE processed alignment files {ENCFF337NRJ|/files/ENCFF337NRJ/} processed by DNase-seq ENCODE4 v3.0.0 GRCh38 pipeline ({ENCPL848KLD|/pipelines/ENCPL848KLD/}) for GRCh38 assembly have a SPOT1 score of 0.33. According to ENCODE standards, SPOT1 score of 0.4 or higher is considered a product of high quality data. Any sample with a SPOT1 score <0.3 should be targeted for replacement with a higher quality sample, and a SPOT1 score of 0.25 is considered minimally acceptable SPOT1 score of 0.25 is considered minimally acceptable for rare and hard to find primary tissues. (See {ENCODE DNase-seq data standards|/data-standards/dnase-seq-encode4/}) |
| Labels |
|
Scores (1)
| ID | Type | Default annotation | Description | Histogram | Range | Summary |
|---|---|---|---|---|---|---|
| DNase-seq_ENCSR000EIR | float |
DNase-seq_ENCSR000EIR |
DNase-seq ENCSR000EIR [biosample_summary="Homo sapiens GM03348 genetically modified (insertion) using transduction targeting H. sapiens MYOD1"]
|
 |
[0.0271, 28.5] |
|
n counts base pairs; sd is the population standard deviation.
Coverage
| Chromosome | Covered positions | Covered % | Segments |
|---|---|---|---|
| all chromosomes | 31164465 | 0.97% | 167923 |
| chr1 | 2958307 | 1.19% | 15805 |
| chr2 | 2569998 | 1.06% | 13901 |
| chr3 | 2027042 | 1.02% | 10991 |
| chr4 | 1518411 | 0.80% | 8299 |
| chr5 | 1734009 | 0.96% | 9477 |
| chr6 | 1854199 | 1.09% | 10053 |
| chr7 | 1525985 | 0.96% | 8292 |
| chr8 | 1451087 | 1.00% | 7777 |
| chr9 | 1365510 | 0.99% | 7315 |
| chr10 | 1547840 | 1.16% | 8324 |
| chr11 | 1641781 | 1.22% | 8803 |
| chr12 | 1536572 | 1.15% | 8220 |
| chr13 | 779034 | 0.68% | 4250 |
| chr14 | 947632 | 0.89% | 5087 |
| chr15 | 1044013 | 1.02% | 5574 |
| chr16 | 955628 | 1.06% | 5109 |
| chr17 | 1366367 | 1.64% | 7266 |
| chr18 | 647014 | 0.81% | 3508 |
| chr19 | 1064343 | 1.82% | 5608 |
| chr20 | 805681 | 1.25% | 4299 |
| chr21 | 362921 | 0.78% | 1928 |
| chr22 | 598821 | 1.18% | 3188 |
| chrX | 832258 | 0.53% | 4672 |
| chrY | 30012 | 0.05% | 177 |
| 3342 contigs with no values (129077085 bp) | 0 | 0.00% | 0 |
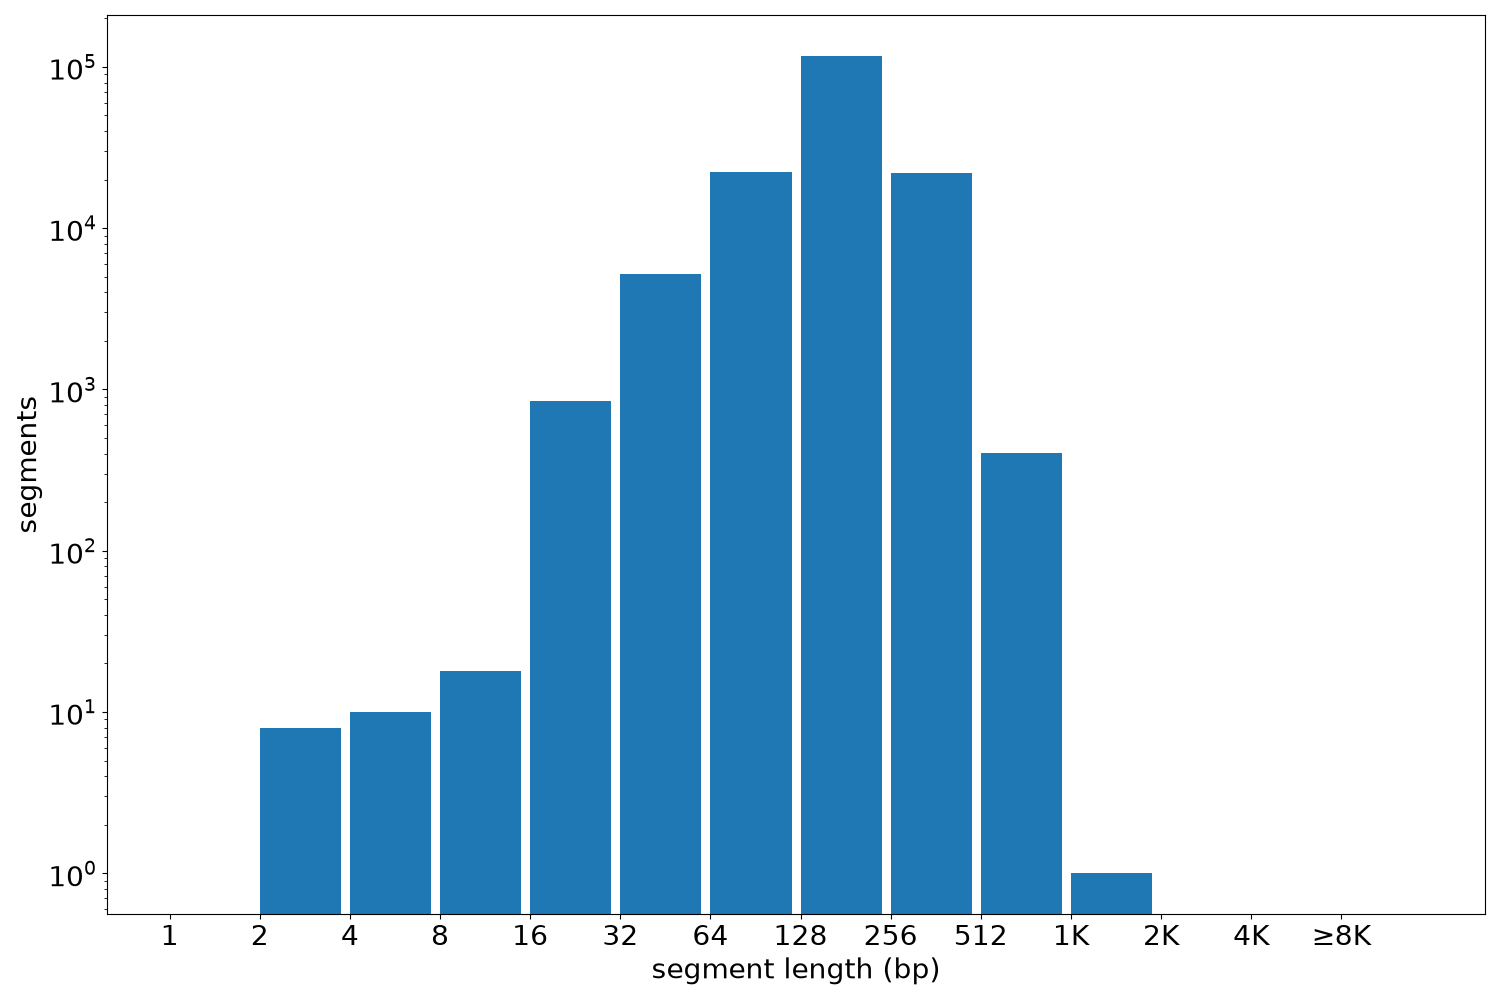
Segment lengths
| segments | min | max | mean | median | |
|---|---|---|---|---|---|
| segments | 167923 | 2 | 1200 | 185.59 | 180 |
Files
| Filename | Size | md5 |
|---|---|---|
| ENCFF900SLD.bed.gz | 1.79 MB | 6b39a2d20adfe71c2b07939e741407b2 |
| ENCFF900SLD.tabix.bed.gz | 1.64 MB | 26f7eec78b512c6747e1dc2f84366f0c |
| ENCFF900SLD.tabix.bed.gz.tbi | 546.24 KB | 1842a2452cf070e9bec46ffb8ee00655 |
| genomic_resource.yaml | 2.54 KB | ce8b3358e2470e01418eb3d758d368e4 |
| statistics/ |