Resource
| Id | DNase-seq/ENCSR000EIF |
|---|---|
| Type | position_score |
| Version | 0 |
| Summary | DNase-seq ENCSR000EIF [biosample_summary="Homo sapiens naive thymus-derived CD4-positive, alpha-beta T cell"] |
| Description |
status: released biological_replicates: Rep 1 summary: mixed sex output_type: peaks audit_internal_action: Released analysis {ENCAN080PFW|/analyses/ENCAN080PFW/} has in progress subobject document {e718d5bd-8aac-44d3-befe-dcfba3140fdc|/documents/e718d5bd-8aac-44d3-befe-dcfba3140fdc/} audit_warning: Signal Portion of Tags (SPOT) is a measure of enrichment, analogous to the commonly used fraction of reads in peaks metric. ENCODE processed alignment files {ENCFF151OJF|/files/ENCFF151OJF/} processed by DNase-seq ENCODE4 v3.0.0 GRCh38 pipeline ({ENCPL848KLD|/pipelines/ENCPL848KLD/}) for GRCh38 assembly have a SPOT1 score of 0.32. According to ENCODE standards, SPOT1 score of 0.4 or higher is considered a product of high quality data. Any sample with a SPOT1 score <0.3 should be targeted for replacement with a higher quality sample, and a SPOT1 score of 0.25 is considered minimally acceptable SPOT1 score of 0.25 is considered minimally acceptable for rare and hard to find primary tissues. (See {ENCODE DNase-seq data standards|/data-standards/dnase-seq-encode4/}) |
| Labels |
|
Scores (1)
| ID | Type | Default annotation | Description | Histogram | Range | Summary |
|---|---|---|---|---|---|---|
| DNase-seq_ENCSR000EIF | float |
DNase-seq_ENCSR000EIF |
DNase-seq ENCSR000EIF [biosample_summary="Homo sapiens naive thymus-derived CD4-positive, alpha-beta T cell"]
|
 |
[0.0714, 42.5] |
|
n counts base pairs; sd is the population standard deviation.
Coverage
| Chromosome | Covered positions | Covered % | Segments |
|---|---|---|---|
| all chromosomes | 10247053 | 0.32% | 59165 |
| chr1 | 1010207 | 0.41% | 5798 |
| chr2 | 709360 | 0.29% | 4166 |
| chr3 | 546029 | 0.28% | 3169 |
| chr4 | 370080 | 0.19% | 2215 |
| chr5 | 446719 | 0.25% | 2625 |
| chr6 | 543804 | 0.32% | 3158 |
| chr7 | 447030 | 0.28% | 2592 |
| chr8 | 392975 | 0.27% | 2290 |
| chr9 | 429837 | 0.31% | 2444 |
| chr10 | 449912 | 0.34% | 2619 |
| chr11 | 577614 | 0.43% | 3366 |
| chr12 | 548465 | 0.41% | 3145 |
| chr13 | 191258 | 0.17% | 1160 |
| chr14 | 338877 | 0.32% | 1945 |
| chr15 | 310950 | 0.30% | 1759 |
| chr16 | 423663 | 0.47% | 2382 |
| chr17 | 637138 | 0.77% | 3602 |
| chr18 | 151220 | 0.19% | 894 |
| chr19 | 769812 | 1.31% | 4235 |
| chr20 | 273384 | 0.42% | 1552 |
| chr21 | 118208 | 0.25% | 701 |
| chr22 | 279052 | 0.55% | 1568 |
| chrX | 269851 | 0.17% | 1696 |
| chrY | 11608 | 0.02% | 84 |
| 3342 contigs with no values (129077085 bp) | 0 | 0.00% | 0 |
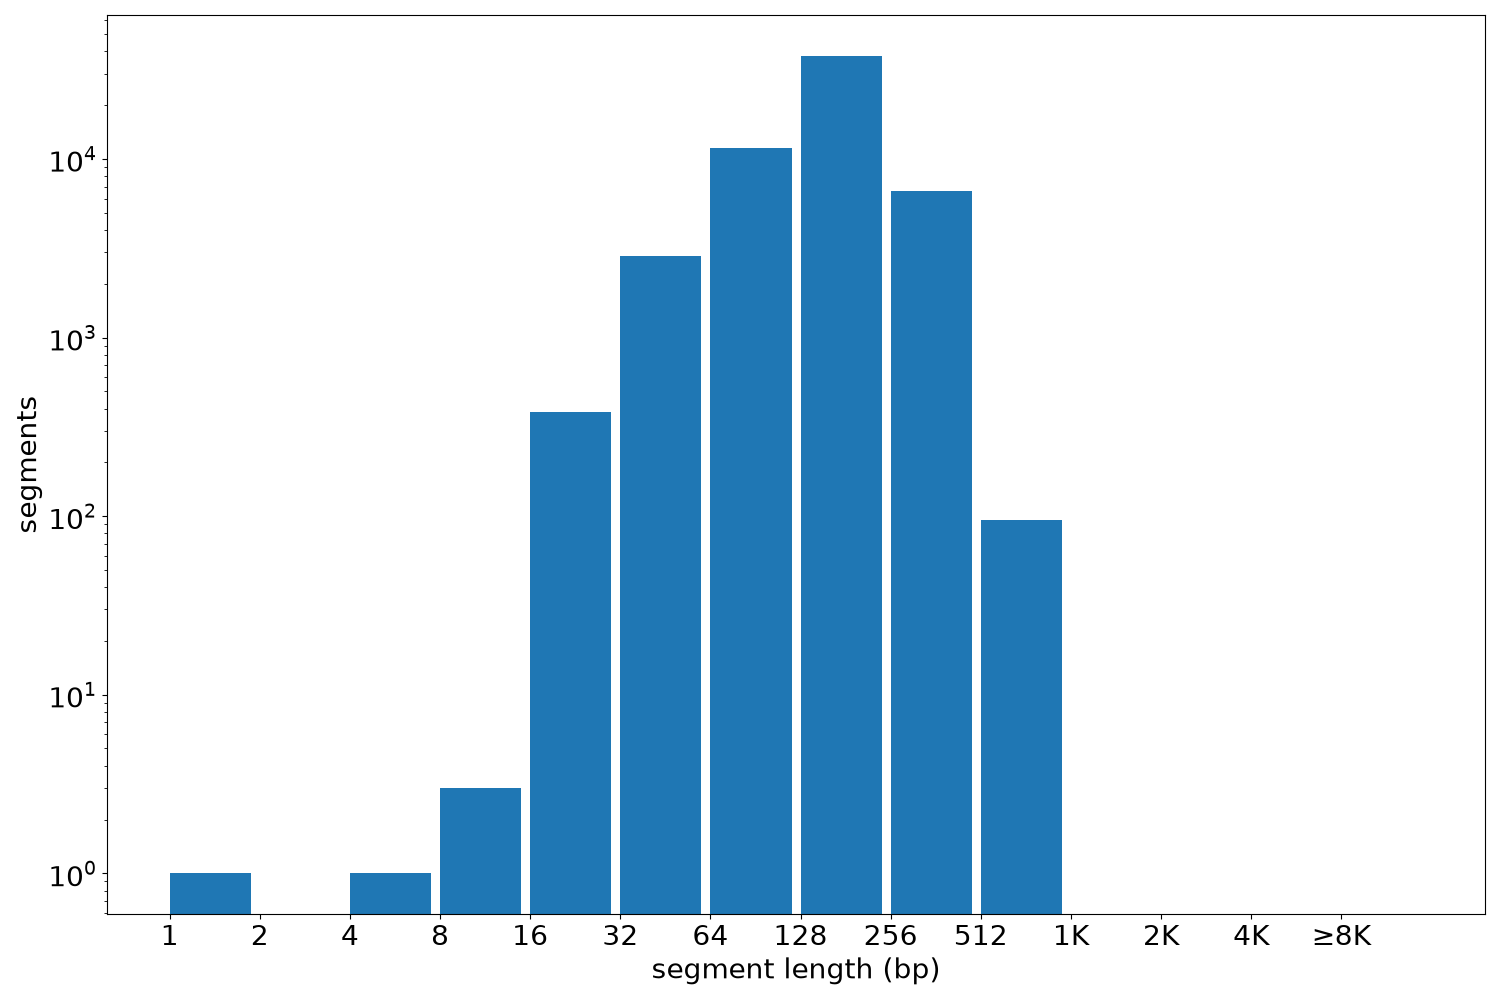
Segment lengths
| segments | min | max | mean | median | |
|---|---|---|---|---|---|
| segments | 59165 | 1 | 780 | 173.19 | 172 |
Files
| Filename | Size | md5 |
|---|---|---|
| ENCFF158VBA.bed.gz | 647.51 KB | 29151a178e3969c2ba19c20f4c97c31b |
| ENCFF158VBA.tabix.bed.gz | 589.37 KB | 785ecd496dcffc40c017ef53ef1be314 |
| ENCFF158VBA.tabix.bed.gz.tbi | 256.79 KB | 33aa2923c9192bd9ff4964de301ec670 |
| genomic_resource.yaml | 2.25 KB | a139c3b934494c283d500d14357d7eef |
| statistics/ |