Resource
| Id | ATAC-seq/ENCSR487QSB |
|---|---|
| Type | position_score |
| Version | 0 |
| Summary | ATAC-seq ENCSR487QSB [biosample_summary="Homo sapiens GM18907"] |
| Description |
status: released biological_replicates: Rep 1 summary: output_type: pseudoreplicated peaks audit_internal_action: Released analysis {ENCAN857RGC|/analyses/ENCAN857RGC/} has in progress subobject quality standard {encode4-atac-seq|/quality-standards/encode4-atac-seq/} audit_internal_action: Released analysis {ENCAN857RGC|/analyses/ENCAN857RGC/} has in progress subobject document {8df5618e-1a16-4365-b65b-9d562defa74a|/documents/8df5618e-1a16-4365-b65b-9d562defa74a/} audit_warning: NRF (Non Redundant Fraction) is equal to the result of the division of the number of reads after duplicates removal by the total number of reads. An NRF value < 0.7 is poor complexity, between 0.7 and 0.9 is moderate complexity, and >= 0.9 high complexity. NRF value > 0.9 is recommended, but > 0.7 is acceptable. ENCODE processed file {ENCFF292BTS|/files/ENCFF292BTS/} processed by ATAC-seq ENCODE4 v1.9.1 GRCh38 pipeline was generated from a library with NRF value of 0.853134. audit_warning: PBC1 (PCR Bottlenecking Coefficient 1, M1/M_distinct) is the ratio of the number of genomic locations where exactly one read maps uniquely (M1) to the number of genomic locations where some reads map (M_distinct). A PBC1 value in the range 0 - 0.5 is severe bottlenecking, 0.5 - 0.8 is moderate bottlenecking, 0.8 - 0.9 is mild bottlenecking, and > 0.9 is no bottlenecking. PBC1 value > 0.9 is recommended, but > 0.7 is acceptable. ENCODE processed file {ENCFF292BTS|/files/ENCFF292BTS/} processed by ATAC-seq ENCODE4 v1.9.1 GRCh38 pipeline was generated from a library with a PBC1 value of 0.85. |
| Labels |
|
Scores (1)
| ID | Type | Default annotation | Description | Histogram | Range | Summary |
|---|---|---|---|---|---|---|
| ATAC-seq_ENCSR487QSB | float |
ATAC-seq_ENCSR487QSB |
ATAC-seq ENCSR487QSB [biosample_summary="Homo sapiens GM18907"]
|
 |
[1.38, 35.1] |
|
n counts base pairs; sd is the population standard deviation.
Coverage
| Chromosome | Covered positions | Covered % | Segments |
|---|---|---|---|
| all chromosomes | 64290102 | 2.00% | 109814 |
| chr1 | 5655187 | 2.27% | 9503 |
| chr2 | 5600864 | 2.31% | 9881 |
| chr3 | 4462488 | 2.25% | 7909 |
| chr4 | 3802742 | 2.00% | 6836 |
| chr5 | 3944458 | 2.17% | 6977 |
| chr6 | 4331128 | 2.54% | 7497 |
| chr7 | 3609167 | 2.26% | 6302 |
| chr8 | 3192950 | 2.20% | 5623 |
| chr9 | 2568517 | 1.86% | 4422 |
| chr10 | 3057729 | 2.29% | 5288 |
| chr11 | 3005747 | 2.23% | 5084 |
| chr12 | 3115416 | 2.34% | 5244 |
| chr13 | 1766869 | 1.54% | 3106 |
| chr14 | 1979604 | 1.85% | 3265 |
| chr15 | 1843087 | 1.81% | 3074 |
| chr16 | 1803913 | 2.00% | 2820 |
| chr17 | 2154222 | 2.59% | 3280 |
| chr18 | 1513651 | 1.88% | 2711 |
| chr19 | 1770258 | 3.02% | 2471 |
| chr20 | 1369027 | 2.12% | 2323 |
| chr21 | 632532 | 1.35% | 1019 |
| chr22 | 832780 | 1.64% | 1222 |
| chrX | 2276208 | 1.46% | 3951 |
| chrY | 1558 | <0.01% | 6 |
| 3342 contigs with no values (129077085 bp) | 0 | 0.00% | 0 |
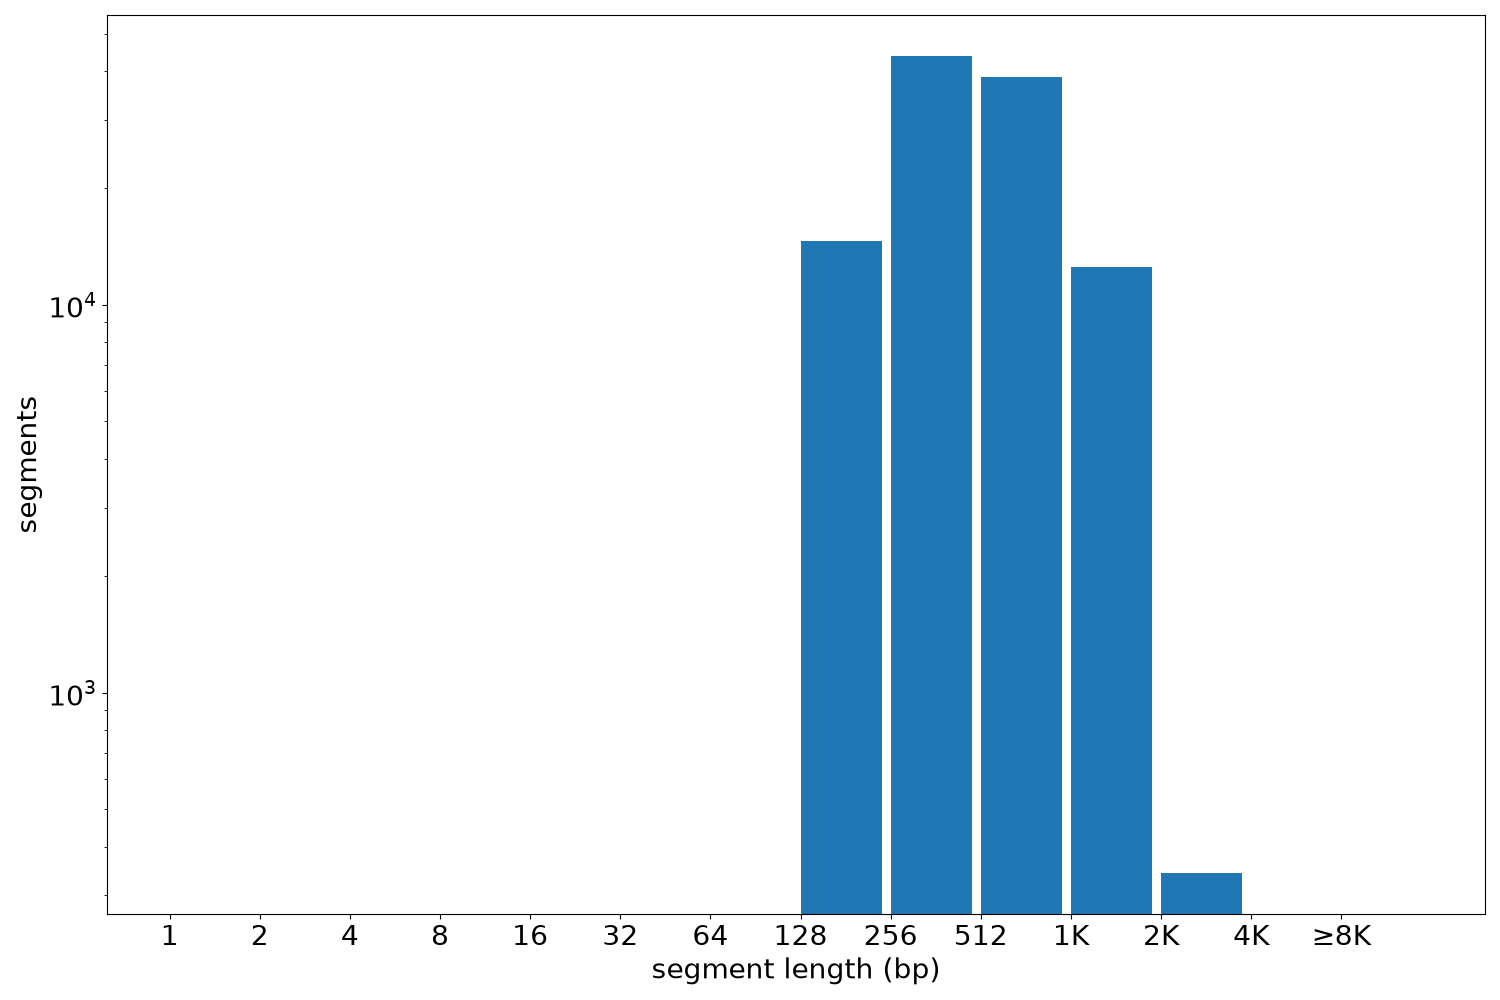
Segment lengths
| segments | min | max | mean | median | |
|---|---|---|---|---|---|
| segments | 109814 | 150 | 3286 | 585.45 | 485 |
Files
| Filename | Size | md5 |
|---|---|---|
| ENCFF903NSQ.bed.gz | 4.62 MB | 1d798119953038aaf177c4de1d548123 |
| ENCFF903NSQ.tabix.bed.gz | 1.22 MB | 2b260d36e852f6cda358b06b6f13a6a3 |
| ENCFF903NSQ.tabix.bed.gz.tbi | 457.17 KB | cb893b07927e0419ad72b98e4dea1a79 |
| genomic_resource.yaml | 2.71 KB | c18680cf9780b7f9bf10a80154b78750 |
| statistics/ |