Resource
| Id | ATAC-seq/ENCSR373NFA |
|---|---|
| Type | position_score |
| Version | 0 |
| Summary | ATAC-seq ENCSR373NFA [biosample_summary="Homo sapiens activated naive CD4-positive, alpha-beta T cell male adult (50 years) treated with anti-CD3 and anti-CD28 coated beads for 72 hours, 50 U/mL Interleukin-2 for 72 hours"] |
| Description |
status: released biological_replicates: Rep 1, Rep 2 summary: male adult (50 years) treated with anti-CD3 and anti-CD28 coated beads for 72 hours, 50 U/mL Interleukin-2 for 72 hours output_type: pseudoreplicated peaks audit_internal_action: Released analysis {ENCAN455WBM|/analyses/ENCAN455WBM/} has in progress subobject quality standard {encode4-atac-seq|/quality-standards/encode4-atac-seq/} audit_warning: NRF (Non Redundant Fraction) is equal to the result of the division of the number of reads after duplicates removal by the total number of reads. An NRF value < 0.7 is poor complexity, between 0.7 and 0.9 is moderate complexity, and >= 0.9 high complexity. NRF value > 0.9 is recommended, but > 0.7 is acceptable. ENCODE processed file {ENCFF913LRH|/files/ENCFF913LRH/} processed by ATAC-seq ENCODE4 v1.10.0 GRCh38 pipeline was generated from a library with NRF value of 0.877176. audit_warning: PBC1 (PCR Bottlenecking Coefficient 1, M1/M_distinct) is the ratio of the number of genomic locations where exactly one read maps uniquely (M1) to the number of genomic locations where some reads map (M_distinct). A PBC1 value in the range 0 - 0.5 is severe bottlenecking, 0.5 - 0.8 is moderate bottlenecking, 0.8 - 0.9 is mild bottlenecking, and > 0.9 is no bottlenecking. PBC1 value > 0.9 is recommended, but > 0.7 is acceptable. ENCODE processed file {ENCFF913LRH|/files/ENCFF913LRH/} processed by ATAC-seq ENCODE4 v1.10.0 GRCh38 pipeline was generated from a library with a PBC1 value of 0.89. audit_warning: NRF (Non Redundant Fraction) is equal to the result of the division of the number of reads after duplicates removal by the total number of reads. An NRF value < 0.7 is poor complexity, between 0.7 and 0.9 is moderate complexity, and >= 0.9 high complexity. NRF value > 0.9 is recommended, but > 0.7 is acceptable. ENCODE processed file {ENCFF151IFP|/files/ENCFF151IFP/} processed by ATAC-seq ENCODE4 v1.10.0 GRCh38 pipeline was generated from a library with NRF value of 0.876699. audit_warning: PBC1 (PCR Bottlenecking Coefficient 1, M1/M_distinct) is the ratio of the number of genomic locations where exactly one read maps uniquely (M1) to the number of genomic locations where some reads map (M_distinct). A PBC1 value in the range 0 - 0.5 is severe bottlenecking, 0.5 - 0.8 is moderate bottlenecking, 0.8 - 0.9 is mild bottlenecking, and > 0.9 is no bottlenecking. PBC1 value > 0.9 is recommended, but > 0.7 is acceptable. ENCODE processed file {ENCFF151IFP|/files/ENCFF151IFP/} processed by ATAC-seq ENCODE4 v1.10.0 GRCh38 pipeline was generated from a library with a PBC1 value of 0.89. |
| Labels |
|
Scores (1)
| ID | Type | Default annotation | Description | Histogram | Range | Summary |
|---|---|---|---|---|---|---|
| ATAC-seq_ENCSR373NFA | float |
ATAC-seq_ENCSR373NFA |
ATAC-seq ENCSR373NFA [biosample_summary="Homo sapiens activated naive CD4-positive, alpha-beta T cell male adult (50 years) treated with anti-CD3 and anti-CD28 coated beads for 72 hours, 50 U/mL Interleukin-2 for 72 hours"]
|
 |
[1.22, 44.2] |
|
n counts base pairs; sd is the population standard deviation.
Coverage
| Chromosome | Covered positions | Covered % | Segments |
|---|---|---|---|
| all chromosomes | 58294305 | 1.81% | 102844 |
| chr1 | 5851742 | 2.35% | 10208 |
| chr2 | 4610124 | 1.90% | 8341 |
| chr3 | 3619837 | 1.83% | 6620 |
| chr4 | 2193636 | 1.15% | 4013 |
| chr5 | 2751408 | 1.52% | 5012 |
| chr6 | 3514577 | 2.06% | 6268 |
| chr7 | 2883427 | 1.81% | 5116 |
| chr8 | 2400830 | 1.65% | 4335 |
| chr9 | 2297621 | 1.66% | 4057 |
| chr10 | 2716388 | 2.03% | 4855 |
| chr11 | 2819773 | 2.09% | 4933 |
| chr12 | 2915397 | 2.19% | 5105 |
| chr13 | 1350019 | 1.18% | 2470 |
| chr14 | 2021929 | 1.89% | 3628 |
| chr15 | 1912413 | 1.88% | 3395 |
| chr16 | 2179608 | 2.41% | 3621 |
| chr17 | 3005181 | 3.61% | 5035 |
| chr18 | 1021801 | 1.27% | 1871 |
| chr19 | 2647329 | 4.52% | 4225 |
| chr20 | 1575260 | 2.44% | 2798 |
| chr21 | 820574 | 1.76% | 1444 |
| chr22 | 1286601 | 2.53% | 2159 |
| chrX | 1779423 | 1.14% | 3103 |
| chrY | 119407 | 0.21% | 232 |
| 3342 contigs with no values (129077085 bp) | 0 | 0.00% | 0 |
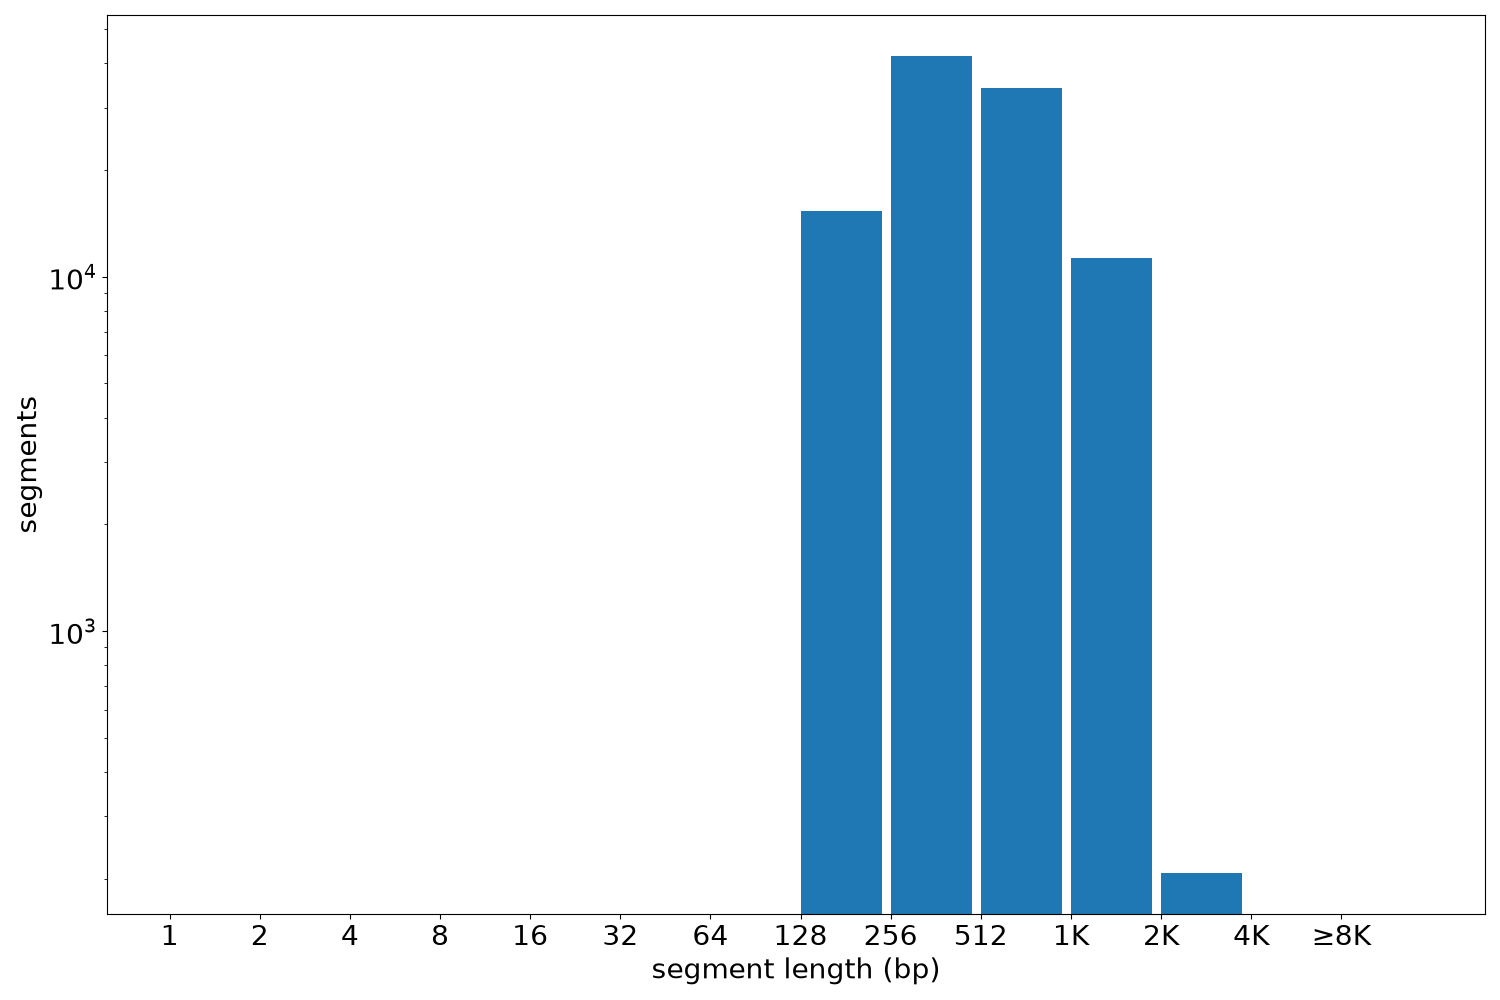
Segment lengths
| segments | min | max | mean | median | |
|---|---|---|---|---|---|
| segments | 102844 | 150 | 3151 | 566.82 | 463 |
Files
| Filename | Size | md5 |
|---|---|---|
| ENCFF792YKT.bed.gz | 3.88 MB | 57220ea5afa9922221079633991358b7 |
| ENCFF792YKT.tabix.bed.gz | 1.12 MB | c0ba0634be075cf983313857f4c63653 |
| ENCFF792YKT.tabix.bed.gz.tbi | 389.4 KB | 37a635528b3003f03ed7fca9609faadd |
| genomic_resource.yaml | 4.31 KB | 441859320c439c867f2ea556bb68cab8 |
| statistics/ |