Resource
| Id | ATAC-seq/ENCSR312UCH |
|---|---|
| Type | position_score |
| Version | 0 |
| Summary | ATAC-seq ENCSR312UCH [biosample_summary="Homo sapiens GM18519"] |
| Description |
status: released biological_replicates: Rep 1 summary: output_type: pseudoreplicated peaks audit_internal_action: Released analysis {ENCAN830RWE|/analyses/ENCAN830RWE/} has in progress subobject quality standard {encode4-atac-seq|/quality-standards/encode4-atac-seq/} audit_not_compliant: According to ENCODE4 standards, overlap peaks files in ATAC-seq assays processed by the uniform processing pipeline should have FRiP (fraction of reads in called peak regions) scores > 0.3. FRiP scores 0.2-0.3 are acceptable, and < 0.2 are not compliant. {ENCFF215TCL|/files/ENCFF215TCL/} processed by ATAC-seq ENCODE4 v1.9.1 GRCh38 pipeline has a FRiP score of 0.20. audit_warning: NRF (Non Redundant Fraction) is equal to the result of the division of the number of reads after duplicates removal by the total number of reads. An NRF value < 0.7 is poor complexity, between 0.7 and 0.9 is moderate complexity, and >= 0.9 high complexity. NRF value > 0.9 is recommended, but > 0.7 is acceptable. ENCODE processed file {ENCFF603MOL|/files/ENCFF603MOL/} processed by ATAC-seq ENCODE4 v1.9.1 GRCh38 pipeline was generated from a library with NRF value of 0.845045. audit_warning: PBC1 (PCR Bottlenecking Coefficient 1, M1/M_distinct) is the ratio of the number of genomic locations where exactly one read maps uniquely (M1) to the number of genomic locations where some reads map (M_distinct). A PBC1 value in the range 0 - 0.5 is severe bottlenecking, 0.5 - 0.8 is moderate bottlenecking, 0.8 - 0.9 is mild bottlenecking, and > 0.9 is no bottlenecking. PBC1 value > 0.9 is recommended, but > 0.7 is acceptable. ENCODE processed file {ENCFF603MOL|/files/ENCFF603MOL/} processed by ATAC-seq ENCODE4 v1.9.1 GRCh38 pipeline was generated from a library with a PBC1 value of 0.89. |
| Labels |
|
Scores (1)
| ID | Type | Default annotation | Description | Histogram | Range | Summary |
|---|---|---|---|---|---|---|
| ATAC-seq_ENCSR312UCH | float |
ATAC-seq_ENCSR312UCH |
ATAC-seq ENCSR312UCH [biosample_summary="Homo sapiens GM18519"]
|
 |
[1.61, 31.6] |
|
n counts base pairs; sd is the population standard deviation.
Coverage
| Chromosome | Covered positions | Covered % | Segments |
|---|---|---|---|
| all chromosomes | 44384814 | 1.38% | 93889 |
| chr1 | 3841431 | 1.54% | 7989 |
| chr2 | 3876236 | 1.60% | 8365 |
| chr3 | 3251050 | 1.64% | 7050 |
| chr4 | 2807062 | 1.48% | 6130 |
| chr5 | 2845408 | 1.57% | 6170 |
| chr6 | 3053653 | 1.79% | 6470 |
| chr7 | 2561483 | 1.61% | 5492 |
| chr8 | 2336178 | 1.61% | 5081 |
| chr9 | 1763884 | 1.27% | 3731 |
| chr10 | 2139754 | 1.60% | 4596 |
| chr11 | 2089351 | 1.55% | 4460 |
| chr12 | 2175210 | 1.63% | 4511 |
| chr13 | 1297715 | 1.13% | 2768 |
| chr14 | 1324287 | 1.24% | 2778 |
| chr15 | 1210966 | 1.19% | 2555 |
| chr16 | 1124840 | 1.25% | 2214 |
| chr17 | 1282818 | 1.54% | 2457 |
| chr18 | 1102334 | 1.37% | 2407 |
| chr19 | 1065621 | 1.82% | 1858 |
| chr20 | 885287 | 1.37% | 1866 |
| chr21 | 460418 | 0.99% | 938 |
| chr22 | 447376 | 0.88% | 837 |
| chrX | 1341710 | 0.86% | 2932 |
| chrY | 100742 | 0.18% | 234 |
| 3342 contigs with no values (129077085 bp) | 0 | 0.00% | 0 |
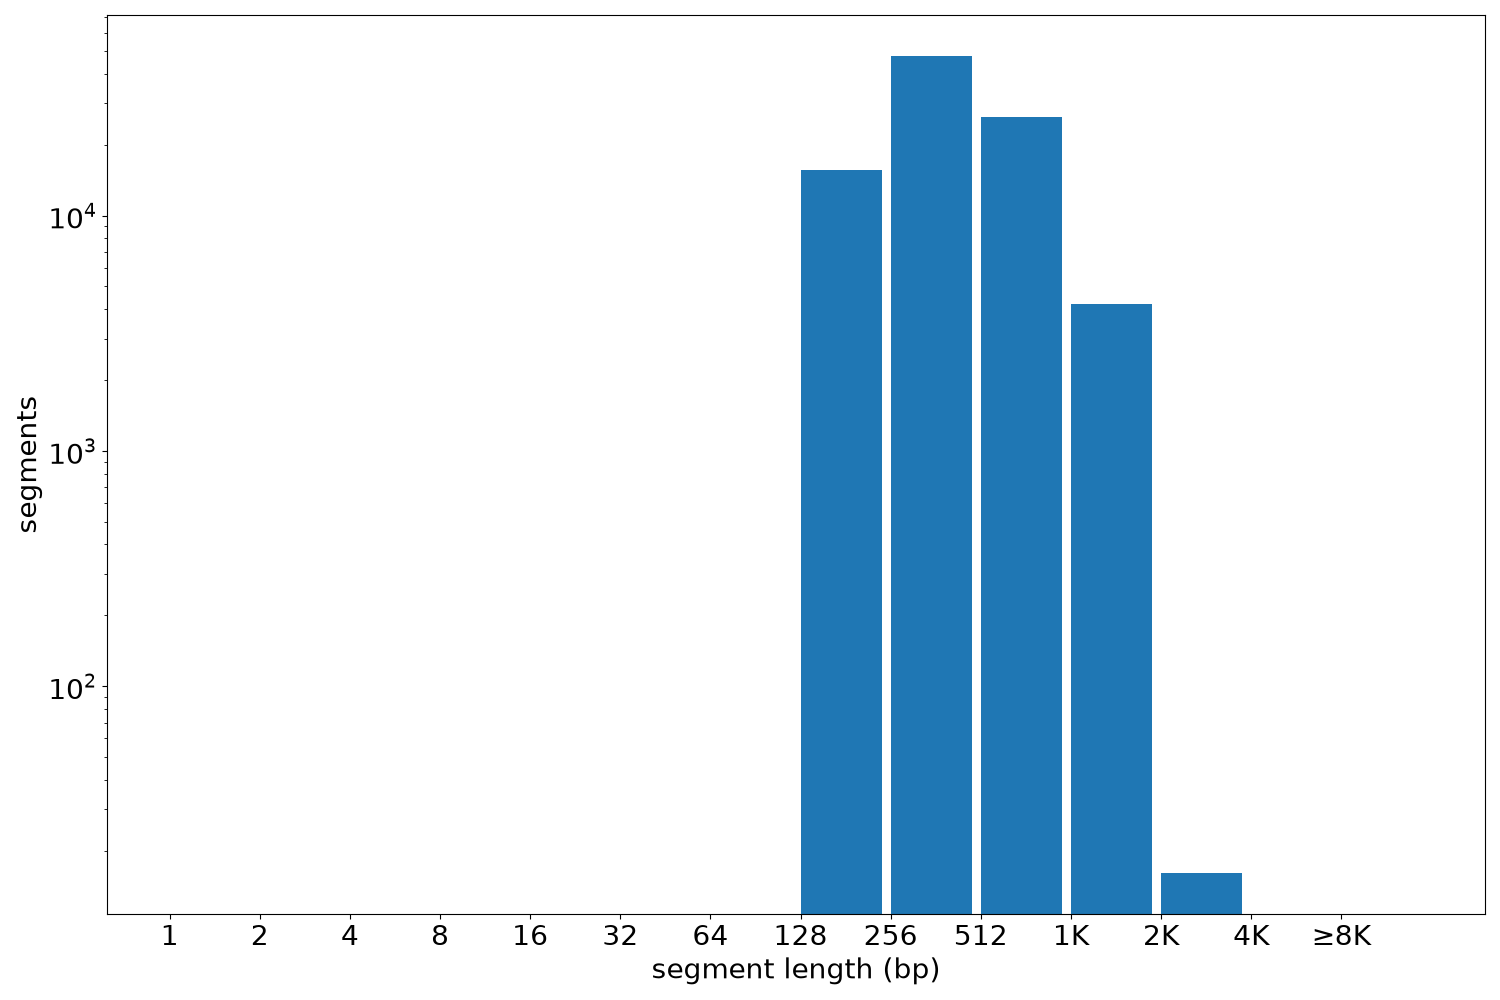
Segment lengths
| segments | min | max | mean | median | |
|---|---|---|---|---|---|
| segments | 93889 | 150 | 2606 | 472.74 | 402 |
Files
| Filename | Size | md5 |
|---|---|---|
| ENCFF215TCL.bed.gz | 3.24 MB | 92250b6502bf08a97b40e8dbf22c3b44 |
| ENCFF215TCL.tabix.bed.gz | 1.02 MB | ca9fa3d0abe1f237e8d9ce53aaa803b2 |
| ENCFF215TCL.tabix.bed.gz.tbi | 436.82 KB | cfac1dfff6acaf535a4863113ea32cdc |
| genomic_resource.yaml | 2.91 KB | e0e12caca07961c05dc1c7dc8e93a2a8 |
| statistics/ |