Resource
| Id | ATAC-seq/ENCSR260LAN |
|---|---|
| Type | position_score |
| Version | 0 |
| Summary | ATAC-seq ENCSR260LAN [biosample_summary="Homo sapiens naive thymus-derived CD4-positive, alpha-beta T cell male adult (48 years)"] |
| Description |
status: released biological_replicates: Rep 1, Rep 2 summary: male adult (48 years) output_type: pseudoreplicated peaks audit_internal_action: Released analysis {ENCAN411JRT|/analyses/ENCAN411JRT/} has in progress subobject quality standard {encode4-atac-seq|/quality-standards/encode4-atac-seq/} audit_not_compliant: NRF (Non Redundant Fraction) is equal to the result of the division of the number of reads after duplicates removal by the total number of reads. An NRF value < 0.7 is poor complexity, between 0.7 and 0.9 is moderate complexity, and >= 0.9 high complexity. NRF value > 0.9 is recommended, but > 0.7 is acceptable. ENCODE processed file {ENCFF991OGT|/files/ENCFF991OGT/} processed by ATAC-seq ENCODE4 v1.10.0 GRCh38 pipeline was generated from a library with NRF value of 0.656739. audit_not_compliant: PBC1 (PCR Bottlenecking Coefficient 1, M1/M_distinct) is the ratio of the number of genomic locations where exactly one read maps uniquely (M1) to the number of genomic locations where some reads map (M_distinct). A PBC1 value in the range 0 - 0.5 is severe bottlenecking, 0.5 - 0.8 is moderate bottlenecking, 0.8 - 0.9 is mild bottlenecking, and > 0.9 is no bottlenecking. PBC1 value > 0.9 is recommended, but > 0.7 is acceptable. ENCODE processed file {ENCFF991OGT|/files/ENCFF991OGT/} processed by ATAC-seq ENCODE4 v1.10.0 GRCh38 pipeline was generated from a library with a PBC1 value of 0.65. audit_not_compliant: NRF (Non Redundant Fraction) is equal to the result of the division of the number of reads after duplicates removal by the total number of reads. An NRF value < 0.7 is poor complexity, between 0.7 and 0.9 is moderate complexity, and >= 0.9 high complexity. NRF value > 0.9 is recommended, but > 0.7 is acceptable. ENCODE processed file {ENCFF184REK|/files/ENCFF184REK/} processed by ATAC-seq ENCODE4 v1.10.0 GRCh38 pipeline was generated from a library with NRF value of 0.667366. audit_not_compliant: PBC1 (PCR Bottlenecking Coefficient 1, M1/M_distinct) is the ratio of the number of genomic locations where exactly one read maps uniquely (M1) to the number of genomic locations where some reads map (M_distinct). A PBC1 value in the range 0 - 0.5 is severe bottlenecking, 0.5 - 0.8 is moderate bottlenecking, 0.8 - 0.9 is mild bottlenecking, and > 0.9 is no bottlenecking. PBC1 value > 0.9 is recommended, but > 0.7 is acceptable. ENCODE processed file {ENCFF184REK|/files/ENCFF184REK/} processed by ATAC-seq ENCODE4 v1.10.0 GRCh38 pipeline was generated from a library with a PBC1 value of 0.67. audit_warning: PBC2 (PCR Bottlenecking Coefficient 2, M1/M2) is the ratio of the number of genomic locations where exactly one read maps uniquely (M1) to the number of genomic locations where two reads map uniquely (M2). A PBC2 value in the range 0 - 1 is severe bottlenecking, 1 - 3 is moderate bottlenecking, 3 - 10 is mild bottlenecking, > 10 is no bottlenecking. PBC2 value > 10 is recommended, but > 3 is acceptable. ENCODE processed file {ENCFF991OGT|/files/ENCFF991OGT/} processed by ATAC-seq ENCODE4 v1.10.0 GRCh38 pipeline was generated from a library with a PBC2 value of 2.73. audit_warning: PBC2 (PCR Bottlenecking Coefficient 2, M1/M2) is the ratio of the number of genomic locations where exactly one read maps uniquely (M1) to the number of genomic locations where two reads map uniquely (M2). A PBC2 value in the range 0 - 1 is severe bottlenecking, 1 - 3 is moderate bottlenecking, 3 - 10 is mild bottlenecking, > 10 is no bottlenecking. PBC2 value > 10 is recommended, but > 3 is acceptable. ENCODE processed file {ENCFF184REK|/files/ENCFF184REK/} processed by ATAC-seq ENCODE4 v1.10.0 GRCh38 pipeline was generated from a library with a PBC2 value of 2.88. |
| Labels |
|
Scores (1)
| ID | Type | Default annotation | Description | Histogram | Range | Summary |
|---|---|---|---|---|---|---|
| ATAC-seq_ENCSR260LAN | float |
ATAC-seq_ENCSR260LAN |
ATAC-seq ENCSR260LAN [biosample_summary="Homo sapiens naive thymus-derived CD4-positive, alpha-beta T cell male adult (48 years)"]
|
 |
[1.32, 44.8] |
|
n counts base pairs; sd is the population standard deviation.
Coverage
| Chromosome | Covered positions | Covered % | Segments |
|---|---|---|---|
| all chromosomes | 41857380 | 1.30% | 69566 |
| chr1 | 4182560 | 1.68% | 6856 |
| chr2 | 3193650 | 1.32% | 5453 |
| chr3 | 2380594 | 1.20% | 4056 |
| chr4 | 1555134 | 0.82% | 2619 |
| chr5 | 1959777 | 1.08% | 3339 |
| chr6 | 2468982 | 1.45% | 4141 |
| chr7 | 2088408 | 1.31% | 3527 |
| chr8 | 1585539 | 1.09% | 2697 |
| chr9 | 1595848 | 1.15% | 2661 |
| chr10 | 1911760 | 1.43% | 3252 |
| chr11 | 2125294 | 1.57% | 3495 |
| chr12 | 2138400 | 1.60% | 3529 |
| chr13 | 939797 | 0.82% | 1600 |
| chr14 | 1471615 | 1.37% | 2471 |
| chr15 | 1346533 | 1.32% | 2291 |
| chr16 | 1618418 | 1.79% | 2570 |
| chr17 | 2392331 | 2.87% | 3842 |
| chr18 | 711769 | 0.89% | 1251 |
| chr19 | 2181422 | 3.72% | 3345 |
| chr20 | 1131810 | 1.76% | 1919 |
| chr21 | 593982 | 1.27% | 956 |
| chr22 | 987963 | 1.94% | 1575 |
| chrX | 1232469 | 0.79% | 2009 |
| chrY | 63325 | 0.11% | 112 |
| 3342 contigs with no values (129077085 bp) | 0 | 0.00% | 0 |
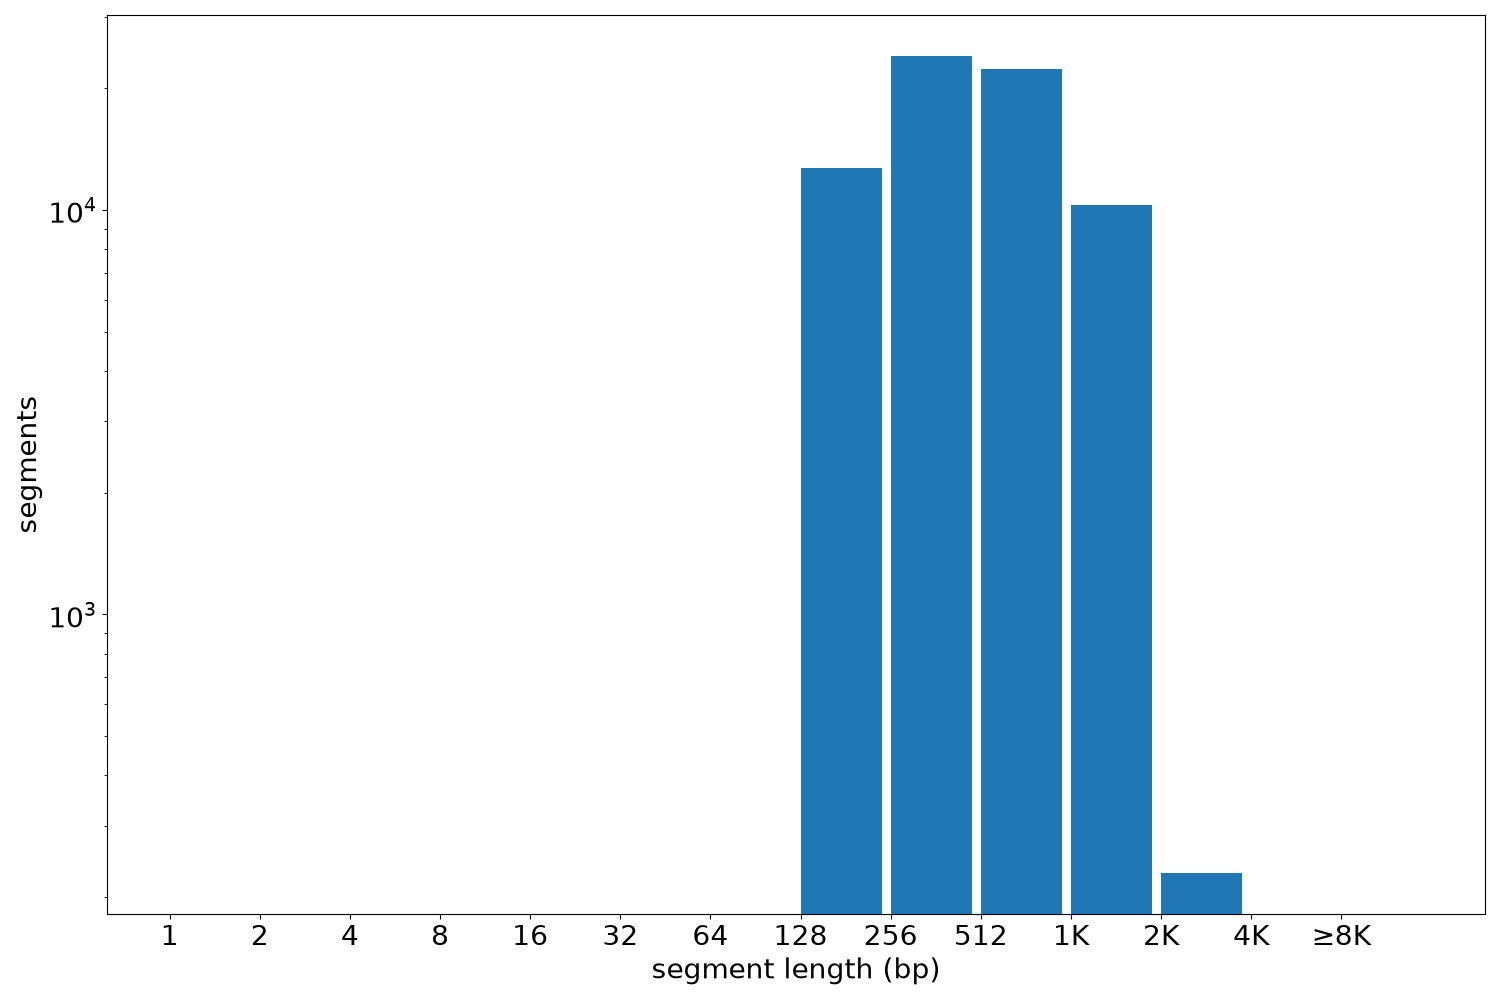
Segment lengths
| segments | min | max | mean | median | |
|---|---|---|---|---|---|
| segments | 69566 | 150 | 3355 | 601.69 | 481 |
Files
| Filename | Size | md5 |
|---|---|---|
| ENCFF705AZV.bed.gz | 3.04 MB | 0267d9f7b11921c566553a9c71caee82 |
| ENCFF705AZV.tabix.bed.gz | 791.75 KB | cde8c575a34f0b840d32314242f17c70 |
| ENCFF705AZV.tabix.bed.gz.tbi | 307.12 KB | ca7dca05916fc21d10b96c330c484d0c |
| genomic_resource.yaml | 5.28 KB | 33d67c01172e6e812bbefcc6ce9412fc |
| statistics/ |